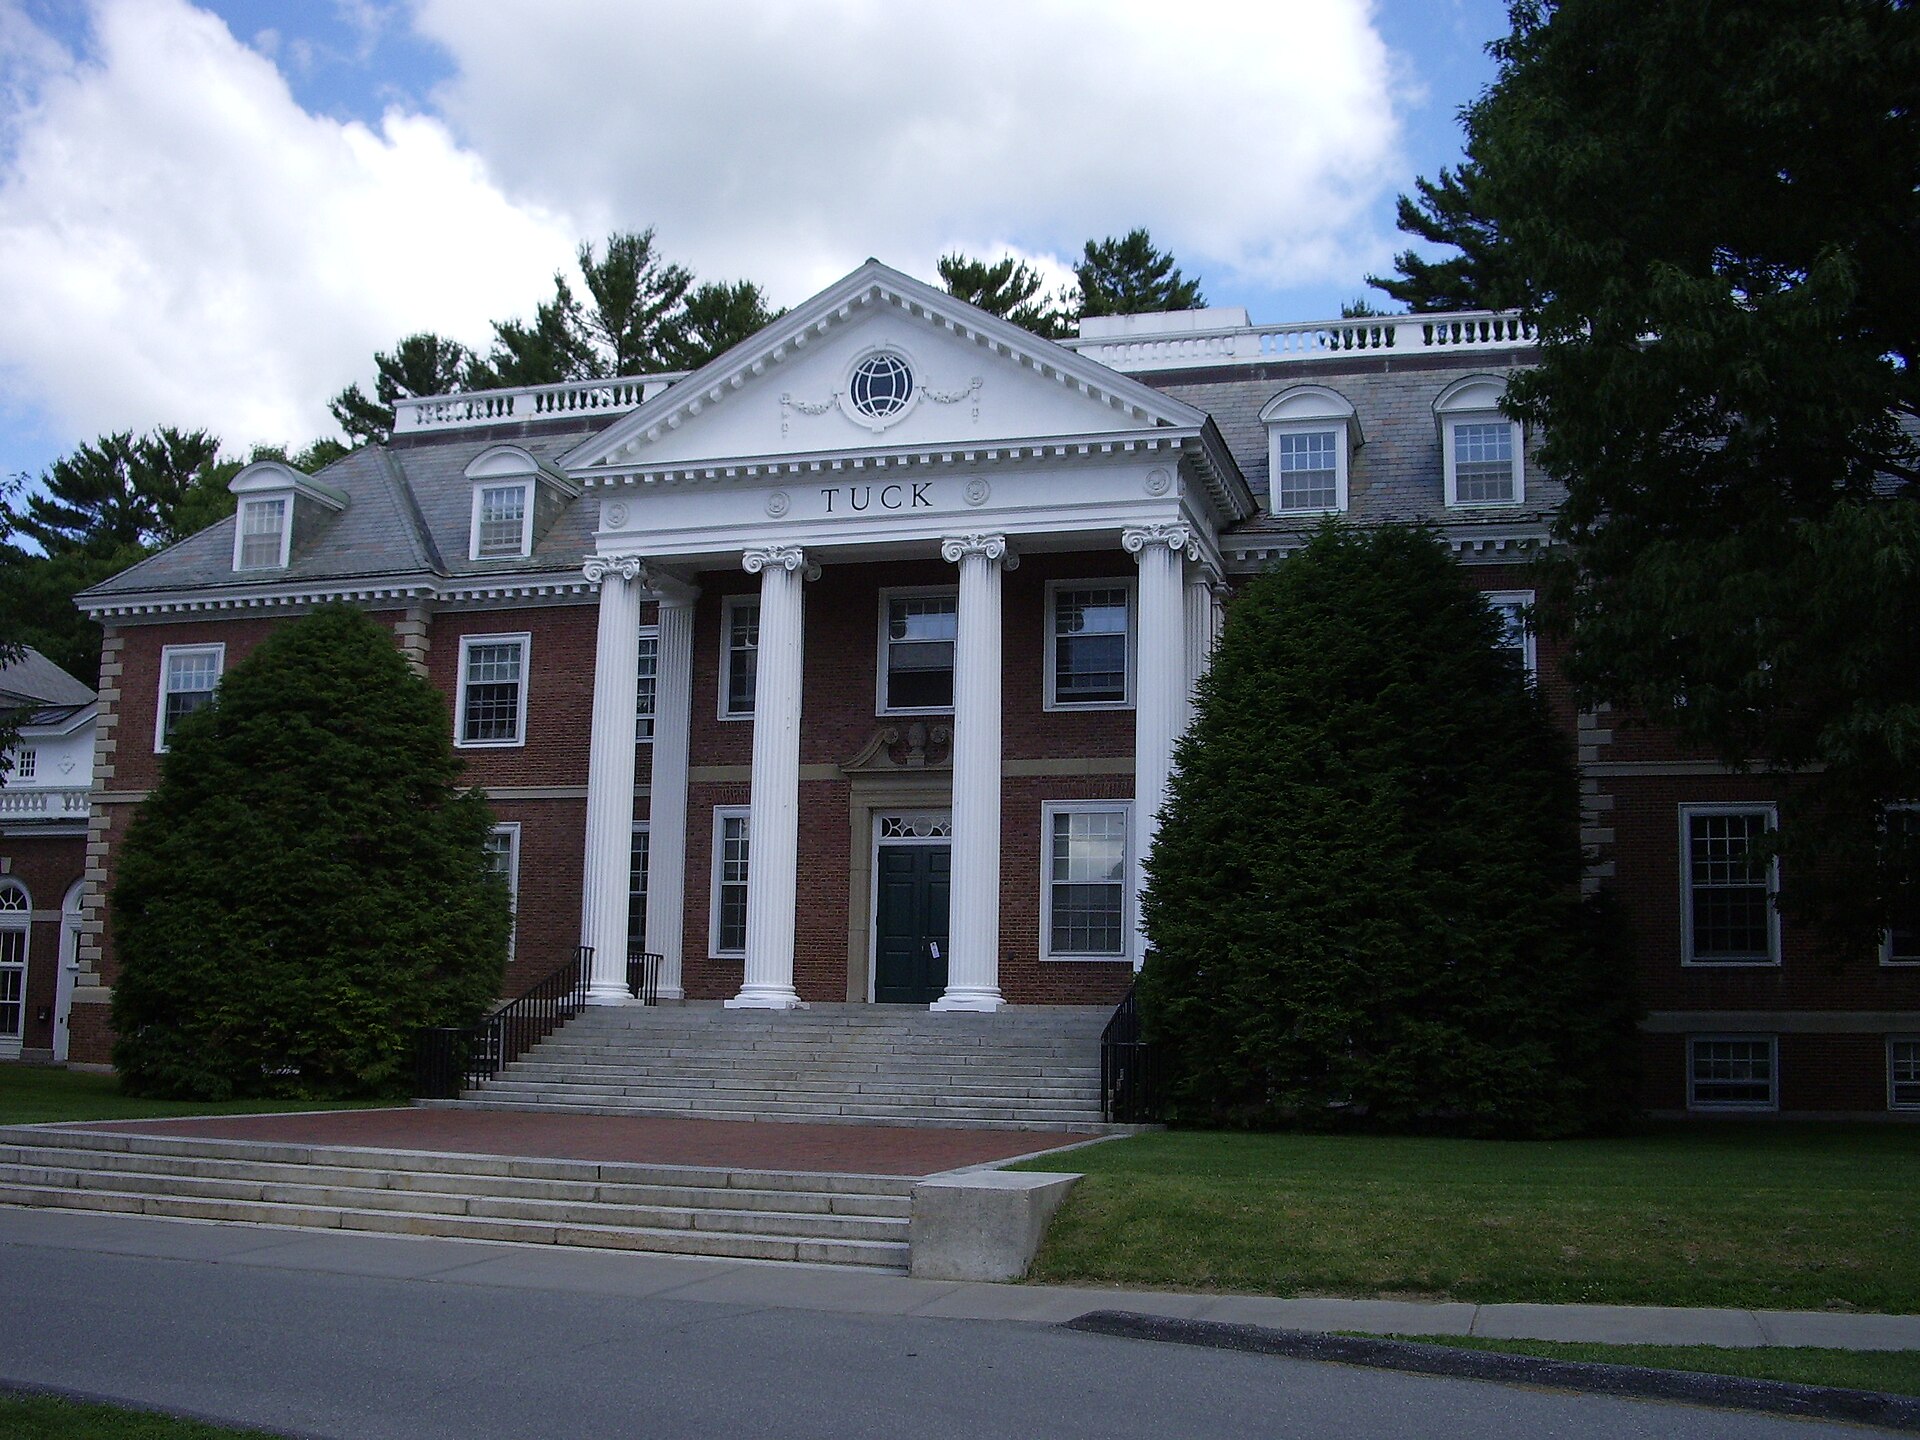
Which Ivy League school has the highest acceptance rate?
Cornell, by a wide margin. The table compares the most recent figures each university has published for the Class of 2030 with the Class of 2029, the class that entered in fall 2025, taken mostly from each Common Data Set (CDS). Decision-day counts can exclude students admitted later from the waitlist, while CDS counts include them, so the two columns are close but not identical in method.
| University | Class of 2030 applicants | Class of 2030 admits | Class of 2030 rate | Class of 2029 rate |
|---|---|---|---|---|
| Cornell | 65,514 | 6,040 | 9.2% | 8.4% (6,077 of 72,523) |
| Penn | 61,264 | 3,575 | 5.8% | 4.9% (3,570 of 72,544) |
| Dartmouth | 28,863 | 1,687 | 5.8% | 6.0% (1,699 of 28,230) |
| Brown | 47,944 | 2,687 | 5.6% | CDS 2025-2026 not found (fall 2024: 5.4%) |
| Yale | 54,919 | 2,328 | 4.2% | 4.7% (2,387 of 50,264) |
| Columbia | 61,031 | 2,581 | 4.2% | 4.9% (2,946 of 59,611) |
| Princeton | 46,618 | 1,892 | 4.1% | 4.4% (1,868 of 42,303) |
| Harvard | Not published | Not published | Not published | 4.2% (2,003 of 47,893) |
Brown publishes two Class of 2030 counts: 2,564 admits from 47,937 applications in its decision-day release of March 26, 2026 (5.3%) and 2,687 from 47,944 on its admission facts page, dated September 2026 (5.6%). Penn has posted its applicant count on its class profile but not its admit count; the dean reported 3,575 admits to the trustees on June 12, 2026, as reported by The Philadelphia Inquirer and The Daily Pennsylvanian. Harvard says that “Beginning with the Class of 2029, Harvard will share annual admissions data in the October/November timeframe” (Harvard admissions statistics). Our Ivy League acceptance rates table tracks each release.
How much higher are early admission rates at the Ivies?
Much higher at the five Ivies with binding Early Decision, judging by the counts they publish. Of the three Ivies with single-choice or restrictive early action, only Yale publishes its early counts; Harvard and Princeton do not.
| University | Early plan | Entering class | Early applicants | Early admits | Early rate | Overall rate |
|---|---|---|---|---|---|---|
| Cornell | Early Decision | Fall 2026 | 7,919 | 1,653 | 20.9% | 9.2% (Regular Decision 7.6%) |
| Dartmouth | Early Decision | Fall 2025 | 3,552 | 768 | 21.6% | 6.0% |
| Brown | Early Decision | Fall 2024 | 6,251 | 898 | 14.4% | 5.4% |
| Columbia | Early Decision | Fall 2025 | 5,868 | 819 | 14.0% | 4.9% |
| Penn | Early Decision | Fall 2025 | 9,503 | 1,266 | 13.3% | 4.9% |
| Yale | Single-choice early action | Fall 2026 | 7,140 | 779 | 10.9% | 4.2% |
| Princeton | Single-choice early action | Not released | Not released | Not released | Not released | 4.1% |
| Harvard | Restrictive early action | Not released | Not released | Not released | Not released | 4.2% (Class of 2029) |
Early pools are not a random sample of applicants, so a higher early rate does not show that applying early caused an admission. Harvard makes that point directly: “Harvard does not offer an advantage to students who apply early. While admit rates tend to be higher in Restrictive Early Action, this reflects the remarkable strength of the applicant pool rather than a benefit of application timing” (Harvard first-year applicants). Princeton stopped releasing round-by-round data in 2022: “We have now made the decision not to release admission data during the early action, regular decision and transfer admission cycles” (Princeton admission announcement).
Early admits also fill a large share of some classes. Penn reports that “52% of the class of 2030 was admitted early decision” (Penn incoming class profile), a share of the enrolled class. At Dartmouth, the 768 Early Decision admits for fall 2025 were 45.2% of all 1,699 admits that year, by our calculation, a share of admitted students rather than of the class. In our view, that makes the Regular Decision round at these schools more competitive than the overall rate suggests. Our Early Decision acceptance rates guide covers more colleges.
Which Ivies admit students from the waitlist?
Six Ivies report how many students they admitted from the waitlist, and the counts are small. Columbia and Dartmouth do not report waitlist counts in readable form.
| University | Entering class | Offered a place | Accepted a place | Admitted from waitlist |
|---|---|---|---|---|
| Penn | Fall 2025 | 3,252 | 2,566 | 60 |
| Princeton | Fall 2025 | 1,370 | 1,086 | 36 |
| Yale | Fall 2025 | 944 | 738 | 32 |
| Harvard | Fall 2025 | Not readable | Not readable | 75 |
| Brown | Fall 2024 | Not reported | Not reported | 118 |
| Cornell | Fall 2026 | 8,922 | 6,849 | Not yet reported (388 for fall 2024) |
| Columbia | Fall 2025 | Not reported | Not reported | Not reported |
| Dartmouth | Fall 2025 | Not readable | Not readable | Not readable |
By our calculation, Penn admitted 2.3% of the students who accepted a waitlist place for fall 2025, Princeton 3.3% and Yale 4.3%. In our experience, families should treat a waitlist place at any Ivy as a remote possibility and commit to another college by May 1.
Does Cornell’s college structure make it easier to get into?
Cornell admits students to one of its undergraduate colleges and schools. Its University Factbook reports applicants and admits for Cornell as a whole and enrollment by college, but not admits by college, and we found no Cornell source for acceptance rates by college. Its admissions FAQ warns against choosing a college for its odds: “Students applying to a particular Cornell college or school solely on the basis of its acceptance rate may find that the selection process works against them” (Cornell admissions FAQ).
What Cornell does publish is enrollment by college. For fall 2026, the Factbook shows 1,182 first-year students expected to enroll in Arts and Sciences, 813 in Engineering, 681 in Agriculture and Life Sciences, 263 in Human Ecology, 169 in Industrial and Labor Relations, 159 in the Dyson School, 157 in the Nolan School of Hotel Administration, 145 in Architecture, Art and Planning, and 112 in the Brooks School of Public Policy (Cornell University Factbook). The contract colleges carry a tuition difference: for 2026-2027, New York residents in those colleges pay $49,816 a year, against $73,946 for nonresidents and for students in Cornell’s endowed colleges (Cornell Office of the Bursar). Our guide to Cornell Early Decision by college covers the application side.
How do financial aid policies differ across the Ivies?
Aid at all eight is need-based: “There are no academic or athletic scholarships in the Ivy League” (Ivy League). Income thresholds, loans and the treatment of international applicants differ.
| University | Loans | Income thresholds stated by the university | International applicants |
|---|---|---|---|
| Harvard | Never required | Zero parent contribution below $100,000; at least full tuition up to $200,000 | Says need “will never affect your chance of being admitted”; same aid as U.S. students |
| Yale | Not in initial offers | Zero parent share below $100,000 with typical assets; scholarship covering at least tuition below $200,000 | Need-blind: “All applicants are evaluated without regard to their ability to pay” |
| Princeton | No-loan policy since 2001 | Most families with incomes up to $150,000 receive aid covering the cost of attendance; most up to $250,000, full tuition | Need-blind |
| Columbia | Not used to meet need | $0 contribution below $66,000; tuition-free from $66,000 to $150,000 | Need-aware |
| Brown | No packaged loans | Tuition, fees, room and meals below $60,000 (assets under $100,000); tuition up to $125,000 | Need-blind for international students “beginning with the Class of 2029” |
| Dartmouth | Not expected in need-based awards | No parent contribution below $125,000 with typical assets | Need-blind “for all applicants, regardless of citizenship” |
| Penn | None required | At least full tuition below $200,000 for families that meet asset conditions (for example, liquid assets of no more than $50,000 and no business or farm) | Need-aware, except citizens and permanent residents of the U.S., Canada and Mexico |
| Cornell | Zero loans below $75,000; capped loans above | $0 expected contribution for most families up to $75,000 | Need-aware |
In our view, an international applicant who needs aid faces a different calculation at the need-aware Ivies (Columbia, Penn and Cornell) than at Brown, Dartmouth, Yale and Princeton, which state need-blind admission for international students, or at Harvard, which says need never affects admission.
Which Ivy League school is hardest to get into?
Among the seven Ivies that have published Class of 2030 figures, Princeton has the lowest rate at 4.1%, followed by Columbia and Yale at 4.2%. For the class that entered in fall 2025 (fall 2024 for Brown), Harvard had the lowest rate at 4.2%, followed by Princeton at 4.4% and Yale at 4.7%.
How should applicants use these numbers?
The view of Oriel Admissions is that the “easiest Ivy” is the one where a student’s record and interests fit best, not the one with the highest rate. Three factors matter more than the headline rate: whether a school has binding Early Decision and how large its early round is, how it treats financial need for your citizenship, and, at Cornell, which college fits the student. Test policies also differ for fall 2027 entry: Columbia and Princeton remain test optional (Columbia; Princeton), while the other six require the SAT or ACT, with limited alternatives: Dartmouth accepts AP, IB or A-Level results from students at high schools outside the U.S. (Dartmouth), Harvard accepts other exams “In exceptional cases when those tests are not accessible” (Harvard), and Penn offers a hardship waiver (Penn). For score planning, see our Academic Index calculator.
Frequently Asked Questions About the Easiest Ivy League Schools
By acceptance rate, Cornell. It admitted 6,040 of 65,514 applicants for the Class of 2030, or 9.2% by our calculation from its University Factbook. Penn and Dartmouth each admitted 5.8%, so the Cornell rate is more than half again as high as the next Ivy. Every Ivy still turns away more than 90% of applicants.
Princeton, at 4.1% (1,892 of 46,618), among the seven Ivies that have published figures. Columbia and Yale follow at 4.2%. Harvard had not published Class of 2030 figures as of October 27, 2026; its Class of 2029 rate was 4.2%.
Early applicants are admitted at higher rates. Cornell admitted 20.9% of Early Decision applicants for fall 2026 against 7.6% in Regular Decision, and Dartmouth admitted 21.6% of Early Decision applicants for fall 2025. Early pools differ in strength, so in the view of Oriel Admissions an early application helps most when the student is already a strong fit.
November 1, 2026 at all eight. Brown, Columbia, Cornell, Dartmouth and Penn offer binding Early Decision; Harvard offers restrictive early action; Yale and Princeton offer single-choice early action. Cornell accepts some supporting materials until November 13.
Cornell does not publish acceptance rates by college, so no official comparison exists. Its admissions FAQ warns that students who apply to a college solely because of its acceptance rate may find the selection process works against them. New York residents do pay lower tuition in the contract colleges: $49,816 against $73,946 for 2026-2027.
Brown, Dartmouth, Yale and Princeton state need-blind admission for international applicants; Brown says it is need-blind for international students beginning with the Class of 2029. Harvard says need never affects admission and gives international students the same aid. Columbia, Penn and Cornell are need-aware for international applicants.
The published counts are small. Cornell admitted 388 from its waitlist for fall 2024, Brown 118 for fall 2024, Harvard 75 for the Class of 2029, Penn 60, Princeton 36 and Yale 32 for fall 2025. Columbia and Dartmouth do not report waitlist admissions in readable form in their Common Data Sets.
No. Columbia and Princeton remain test optional for students entering in fall 2027 and will require scores from fall 2028 entry. Brown, Cornell, Dartmouth, Harvard, Penn and Yale require the SAT or ACT, with limited alternatives: Dartmouth accepts AP, IB or A-Level results from students at schools outside the U.S., Harvard accepts other exams in exceptional cases, and Penn offers a hardship waiver.
Sources: Cornell University Factbook, first-year admissions, Penn incoming class profile, Penn Common Data Set 2025-2026, Dartmouth News, March 2026, Dartmouth Common Data Set 2025-2026, Brown admission facts, Brown Common Data Set 2024-2025, Yale News, March 26, 2026, Yale News, December 17, 2025, Yale Common Data Set 2025-2026, Columbia Class of 2030 announcement, Columbia Common Data Set 2025-2026, Princeton profile, admission and costs, Princeton Common Data Set 2025-2026, Harvard admissions statistics, Harvard Common Data Set 2025-2026, Cornell admissions FAQ, Cornell Office of the Bursar. All read October 26 and 27, 2026.
About Oriel Admissions
Oriel Admissions is a college admissions consulting firm advising families nationwide on elite university admissions strategy, with offices in Princeton, New Jersey and New York. Our team pairs deep admissions expertise with a distinctive 360 approach spanning academic planning, extracurricular strategy, essays and application execution. To discuss your strategy, schedule a consultation.