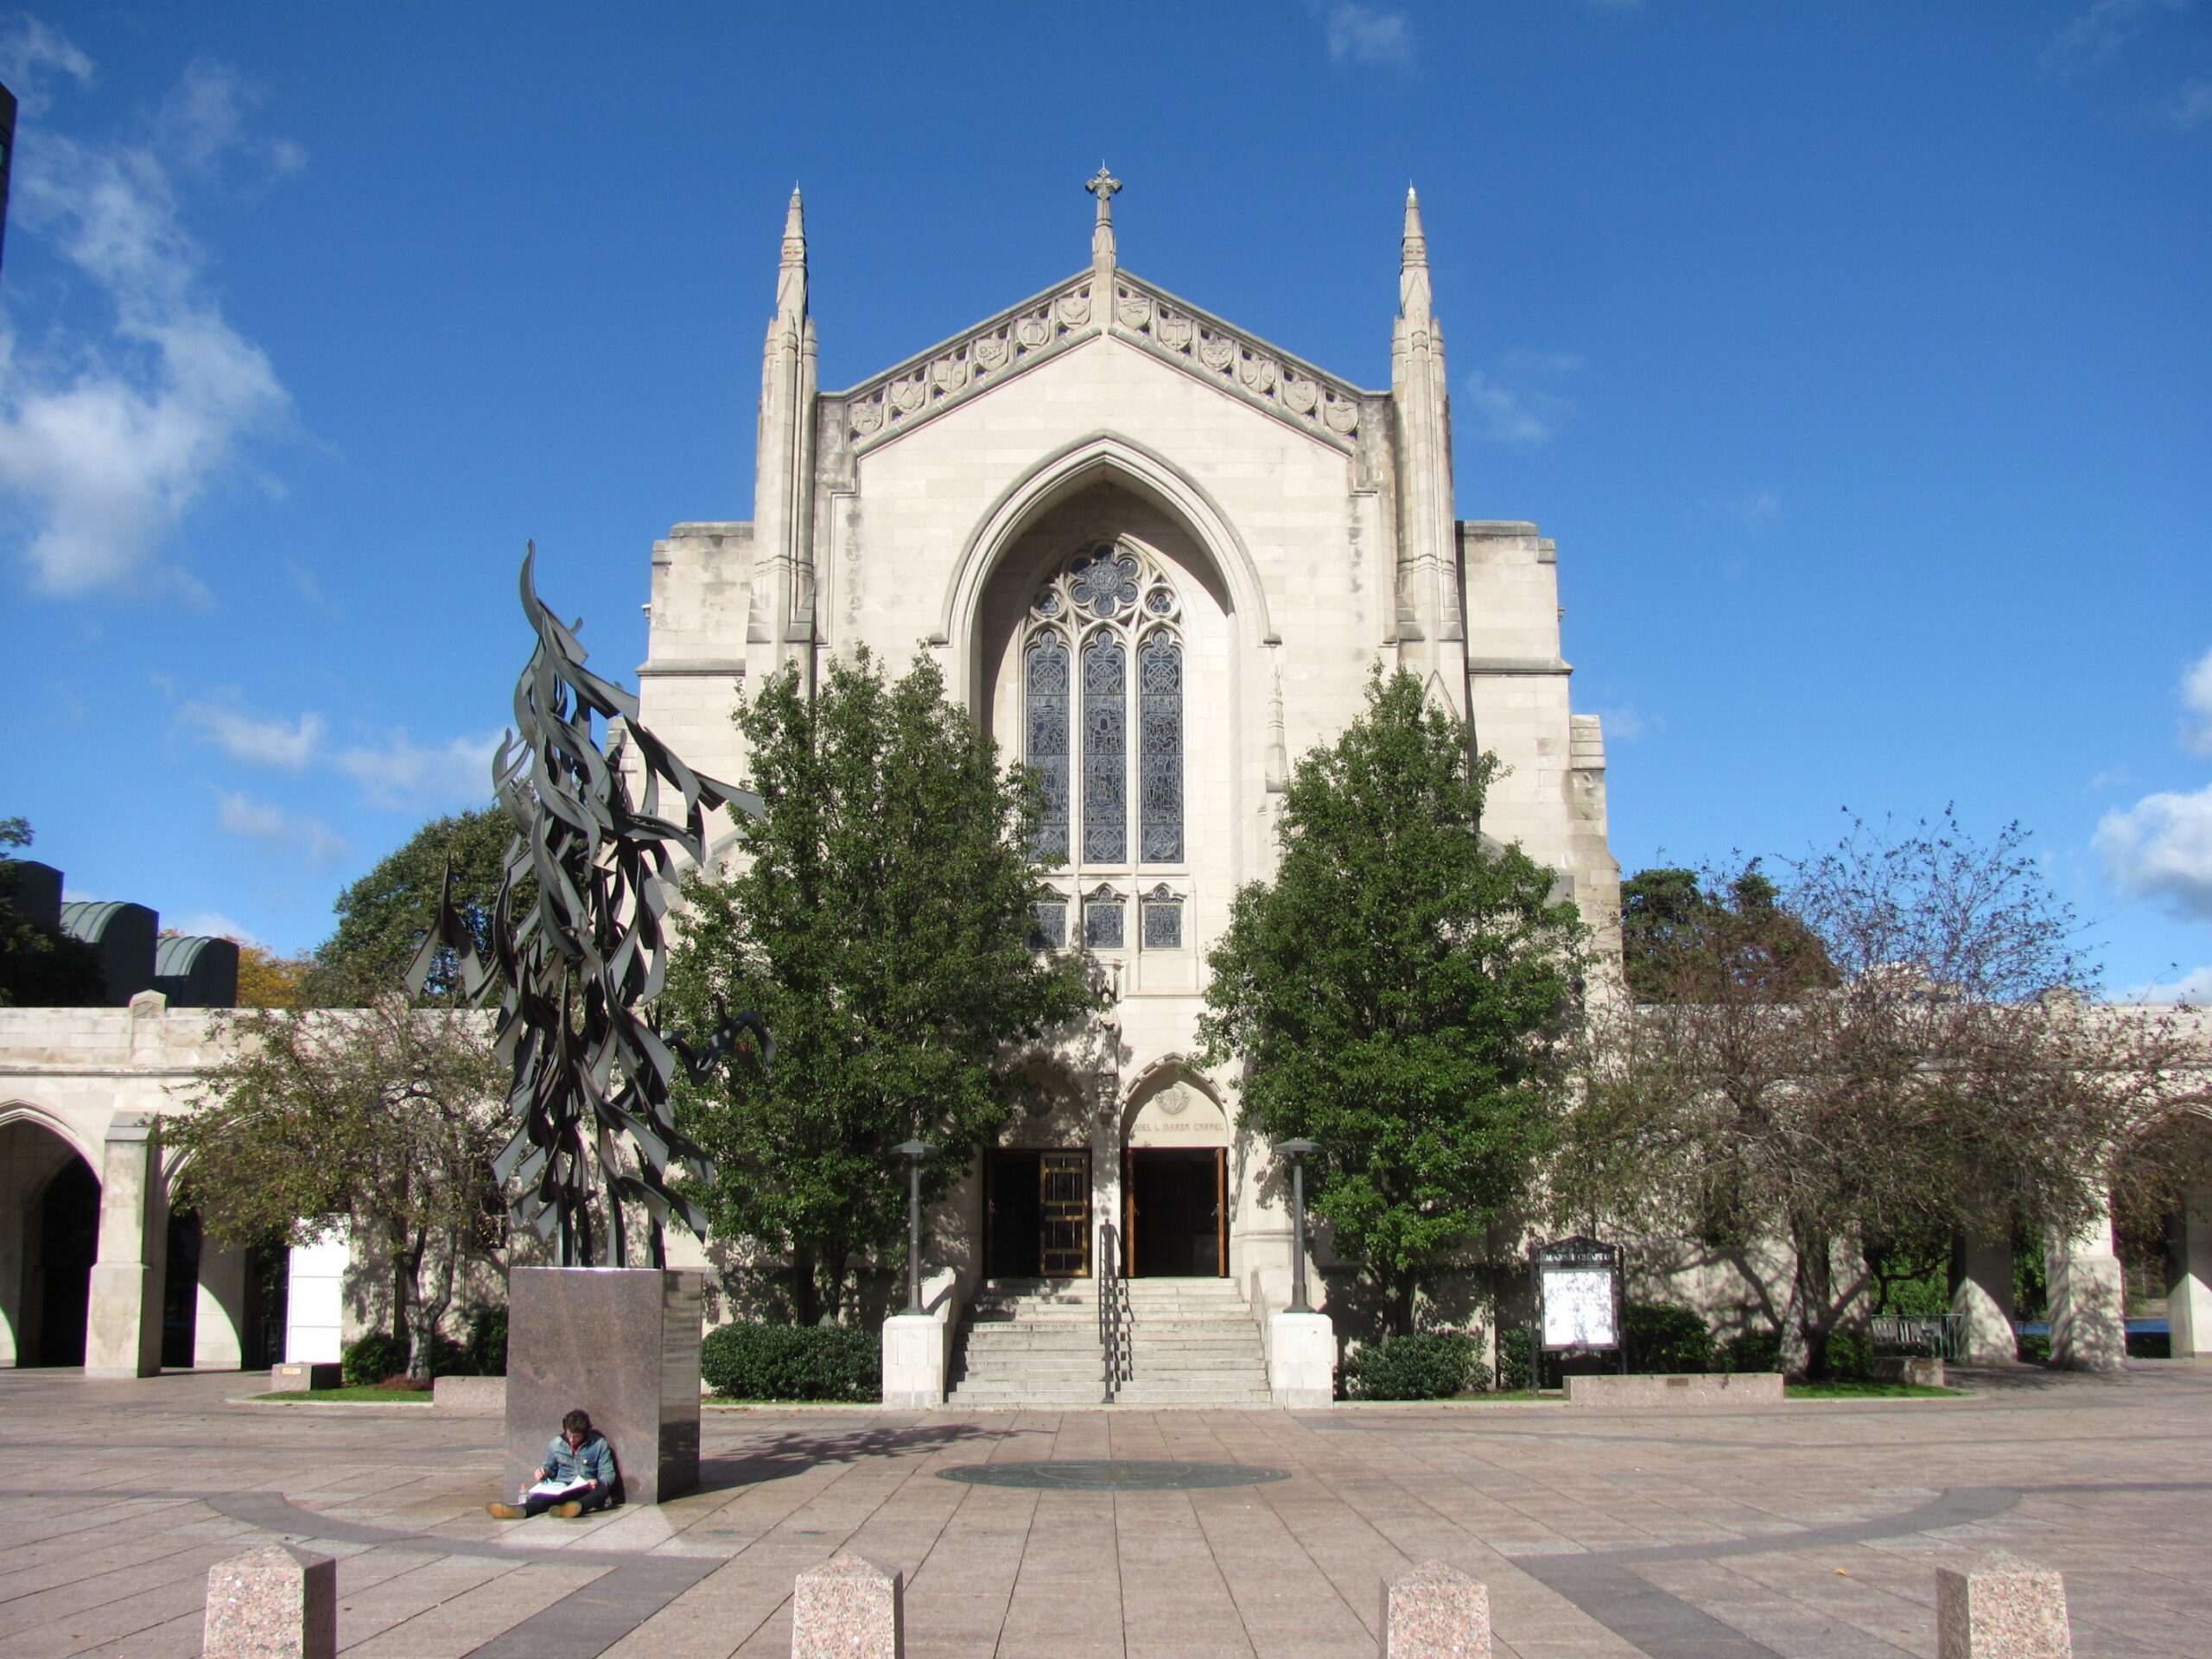
Boston University Early Decision Acceptance Rate: Why the Binding Rounds Moved Counter-Trend
By Rona Aydin
TL;DR: The Boston University Early Decision acceptance rate was 31.3% for the Class of 2029, with 2,165 students admitted from 6,907 binding applications across ED I and ED II, against 11.0% for applicants outside the binding rounds and a 12.8% overall rate (BU Common Data Set 2025-2026). BU runs two binding rounds and no Early Action: ED I closes November 1 with decisions December 15, and ED II closes January 5 with decisions February 15. BU is test optional through fall 2028 entry, and binding admits fill roughly 63% of enrolled seats. For families weighing a binding application to BU, Oriel Admissions builds the round strategy around your student’s specific position: schedule a consultation.
What Is the Boston University Early Decision Acceptance Rate?
The Boston University Early Decision acceptance rate for the Class of 2029 was 31.3%: 6,907 students applied through the two binding rounds and 2,165 received offers, per the university’s Common Data Set 2025-2026. Applicants outside the binding rounds were admitted at 11.0%, with 7,688 offers from 69,869 applications, and the blended overall rate was 12.8% on 76,776 total applications. Nearly one in three binding applicants received an offer, which makes BU one of the most ED-responsive schools among large private research universities, and every figure in this guide comes from the audited Common Data Set rather than press coverage.
| Entering Class | ED Applications | ED Admits | ED Acceptance Rate |
|---|---|---|---|
| Class of 2030 | Not released | Not released | Awaits next CDS |
| Class of 2029 | 6,907 | 2,165 | 31.3% |
| Class of 2028 | 6,854 | 1,936 | 28.2% |
The direction of travel is the unusual part. At most highly selective schools, binding-round rates have compressed year over year; at BU they rose, from 28.2% to 31.3%, while binding volume held nearly flat at roughly 6,900 applications. BU has not released Class of 2030 figures, and the rate for that cycle will only be computable when the next Common Data Set is filed. The overall admissions picture, cycle by cycle, lives in our Boston University acceptance rate base guide, and cross school binding round comparisons live in our Early Decision acceptance rates hub.
Two Binding Rounds, No Early Action: The BU Calendar
BU offers exactly three pathways, and two of them are binding. There is no Early Action, so a student who wants a December answer from BU must sign the ED agreement to get one. ED I closes November 1 with decisions on December 15, ED II closes January 5 with decisions on February 15, and Regular Decision closes January 5 with notification by April 1, all per the Common Data Set 2025-2026. Admitted binding applicants owe the enrollment deposit quickly, January 9 for ED I and February 15 for ED II, so the financial conversation must happen before the application goes in, not after the decision arrives. The two round structure gives applicants a genuine second binding window in January, a calculus we map in our Early Decision II strategy guide.
| Round | Application Deadline | Notification | Binding |
|---|---|---|---|
| Early Decision I | November 1 | December 15 | Yes |
| Early Decision II | January 5 | February 15 | Yes |
| Regular Decision | January 5 | By April 1 | No |
The Counter-Trend Cycle: What Moved and Why It Matters
Three numbers moved against the national pattern in one cycle. Total applications fell from 78,769 to 76,776 while admits rose from 8,749 to 9,853, lifting the overall rate from 11.1% to 12.8%. The Boston University Early Decision acceptance rate rose in step, 28.2% to 31.3%. And the waitlist went from nearly ornamental to genuinely active: 18 waitlist admits for the Class of 2028, then 479 for the Class of 2029, from 10,393 students who accepted a place on a 16,135-offer list. At 31.3% against 11.0%, the binding advantage runs about 2.8x, and the 2,165 binding admits account for roughly 63% of the 3,449 enrolled seats, which means the Regular pool competes for barely a third of the class. The usual caveats apply, recruited athletes and institutional priorities concentrate in the early pool, so the true like for like advantage is smaller than the raw multiple; our Early Decision versus Regular Decision guide covers how to discount published multiples, our ED versus RD acceptance rate comparison shows where BU’s 2.8x sits among peers, and our ED versus RD advantage calculator lets you model the arithmetic for a specific profile.
Testing, Aid, and the Binding Commitment
Two policy facts should shape any binding application to BU. First, testing: BU is test optional for students applying through fall 2028 and spring 2029 entry, and the policy covers every undergraduate school and every scholarship program, so an ED I application without scores carries no structural penalty. The submission math still matters: only 36% of enrolled students submitted an SAT, with a middle 50% of 1420 to 1510, and 10% submitted an ACT at a 33 to 34 middle 50%, against an average admitted GPA of 3.86, so a score inside the published range strengthens a file and a score below it should stay home. Second, money: admitted binding applicants owe a nonrefundable enrollment deposit within weeks of the decision, and BU’s own Early Decision agreement carries the standard release, a student whose financial aid award does not make attendance possible may decline the offer and exit the commitment. Families should model the expected net cost before November 1 rather than testing it in December, mechanics we cover in Early Decision and financial aid. The complete admissions playbook lives in our guide on how to get into Boston University.
Frequently Asked Questions About the Boston University Early Decision Acceptance Rate
The Boston University Early Decision acceptance rate was 31.3% for the Class of 2029, with 2,165 students admitted from 6,907 applications across the ED I and ED II rounds, per the university’s Common Data Set 2025-2026. Applicants outside the binding rounds were admitted at 11.0%, against a 12.8% overall rate.
Yes, and the gap is wide: 31.3% in the binding rounds against 11.0% outside them, roughly 2.8x. Binding admits fill roughly 63% of enrolled seats, so the Regular pool competes for barely a third of the class. Recruited athletes and institutional priorities concentrate in the early pool, so an unhooked applicant should discount the raw multiple, but nearly one in three binding applicants received an offer in the most recent audited cycle.
No. BU offers exactly three pathways: binding Early Decision I closing November 1 with decisions December 15, binding Early Decision II closing January 5 with decisions February 15, and Regular Decision closing January 5 with notification by April 1. A student who wants an early answer from BU must sign the binding agreement to get one.
ED I if BU is the clear first choice and the file is complete at a competitive level by November 1. ED II serves two profiles: a student whose fall semester materially strengthened the record, and a student denied or released from a binding round elsewhere in December who is certain BU is next. Both rounds carry the identical binding commitment and fast deposit deadlines, January 9 for ED I admits and February 15 for ED II admits; only the calendar differs.
Applications fell from 78,769 to 76,776 while admits rose from 8,749 to 9,853, lifting the overall rate from 11.1% to 12.8% and the Early Decision rate from 28.2% to 31.3%. BU also leaned on its waitlist far more heavily, admitting 479 students from the list for the Class of 2029 after admitting 18 the prior year. Enrollment management, not a change in applicant strength, drove the move.
No. BU is test optional for students applying through fall 2028 and spring 2029 entry, and the policy applies to every undergraduate school and every scholarship program. Among enrolled students, 36% submitted an SAT with a middle 50% of 1420 to 1510 and 10% submitted an ACT with a middle 50% of 33 to 34, so a score inside the published range strengthens a binding application and a score below it can be withheld without penalty.
BU’s own Early Decision agreement carries the standard release: a student who applies for financial aid and does not receive an award that makes attendance possible may decline the offer and exit the binding commitment. Admitted binding applicants owe a nonrefundable enrollment deposit quickly, January 9 for ED I and February 15 for ED II, so families should model the expected net cost before the application goes in rather than after the decision arrives.
A deferred applicant continues in the Regular pool with the binding obligation released and should submit midyear grades plus a focused update. A denied applicant is done at BU for the cycle, and the productive January move is a binding ED II application at another university, or at BU itself for a student originally denied elsewhere. The waitlist is also a live path at BU now, with 479 admitted from the list in the most recent audited cycle, but the January 5 deadlines mean the rest of the list must be ready before December decisions arrive.
Sources: Boston University Common Data Set, Analytical Services and Institutional Research; BU Common Data Set 2025-2026, Section C; Boston University Early Decision Agreement; NCES College Navigator, Boston University; Common Data Set Initiative; NACAC.
About Oriel Admissions
Oriel Admissions is a Princeton-based college admissions consulting firm advising families nationwide on elite university admissions strategy. Our team pairs deep admissions expertise with a distinctive 360 approach spanning academic planning, extracurricular strategy, essays and application execution. To discuss your strategy, schedule a consultation.