Most Competitive Colleges: Acceptance Rates for 37 Selective Schools by Selectivity Band
By Rona Aydin

How did we choose the most competitive colleges?
This guide covers 37 colleges that, in the view of Oriel Admissions, are among the most selective in the United States and that, in our experience, families ask us about most: the eight Ivy League schools, 18 other private universities, six liberal arts colleges and five public universities. It is not a ranking and not a complete list of every selective college. We group the schools into three bands by their most recent official acceptance rate: under 5%, 5% to just under 10%, and 10% to 17%. Each rate comes from the college’s own Common Data Set (CDS), admissions profile or announcement, and each is labeled with its year.
What are the acceptance rates at the most competitive colleges?
| College | Type | Latest acceptance rate | Entering class | Admits of applicants |
|---|---|---|---|---|
| Caltech | Private university | 3.8% | fall 2025 (Class of 2029) | 428 of 11,285 |
| Stanford | Private university | 3.8% | fall 2025 (Class of 2029) | 2,302 of 60,646 |
| Princeton | Ivy League | 4.1% | fall 2026 (Class of 2030) | 1,892 of 46,618 |
| Columbia | Ivy League | 4.2% | fall 2026 (Class of 2030) | 2,581 of 61,031 |
| Harvard | Ivy League | 4.2% | fall 2025 (Class of 2029) | 2,003 of 47,893 |
| Yale | Ivy League | 4.2% | fall 2026 (Class of 2030) | 2,328 of 54,919 |
| University of Chicago | Private university | 4.5% | fall 2025 (Class of 2029) | 2,039 of 45,533 |
| MIT | Private university | 4.6% | fall 2025 (Class of 2029) | 1,334 of 29,281 |
| Vanderbilt | Private university | 4.6% | fall 2026 (Class of 2030) | 2,519 of 54,792 |
| Duke | Private university | 4.7% | fall 2026 (Class of 2030) | 2,930 of 61,935 |
| Penn | Ivy League | 4.9% | fall 2025 (Class of 2029) | 3,570 of 72,544 |
| Brown | Ivy League | 5.6% | fall 2026 (Class of 2030) | 2,687 of 47,944 |
| Northeastern | Private university | 5.6% | fall 2025 (Class of 2029) | 5,920 of 105,256 |
| Dartmouth | Ivy League | 5.8% | fall 2026 (Class of 2030) | 1,687 of 28,863 |
| Johns Hopkins | Private university | 6.1% | fall 2025 (Class of 2029) | 3,072 of 50,259 |
| Bowdoin | Liberal arts college | 6.5% | fall 2026 (Class of 2030) | 962 of 14,727 |
| Amherst | Liberal arts college | 6.8% | fall 2026 (Class of 2030) | 1,209 of 17,786 |
| Northwestern | Private university | approximately 7% | fall 2026 (Class of 2030) | approximately 7% printed, no admit count |
| Swarthmore | Liberal arts college | 7.4% | fall 2026 (Class of 2030) | 969 of 13,029 |
| Rice | Private university | 8.0% | fall 2025 (Class of 2029) | 2,948 of 36,791 |
| Williams | Liberal arts college | 8.6% | fall 2025 (Class of 2029) | 1,336 of 15,520 |
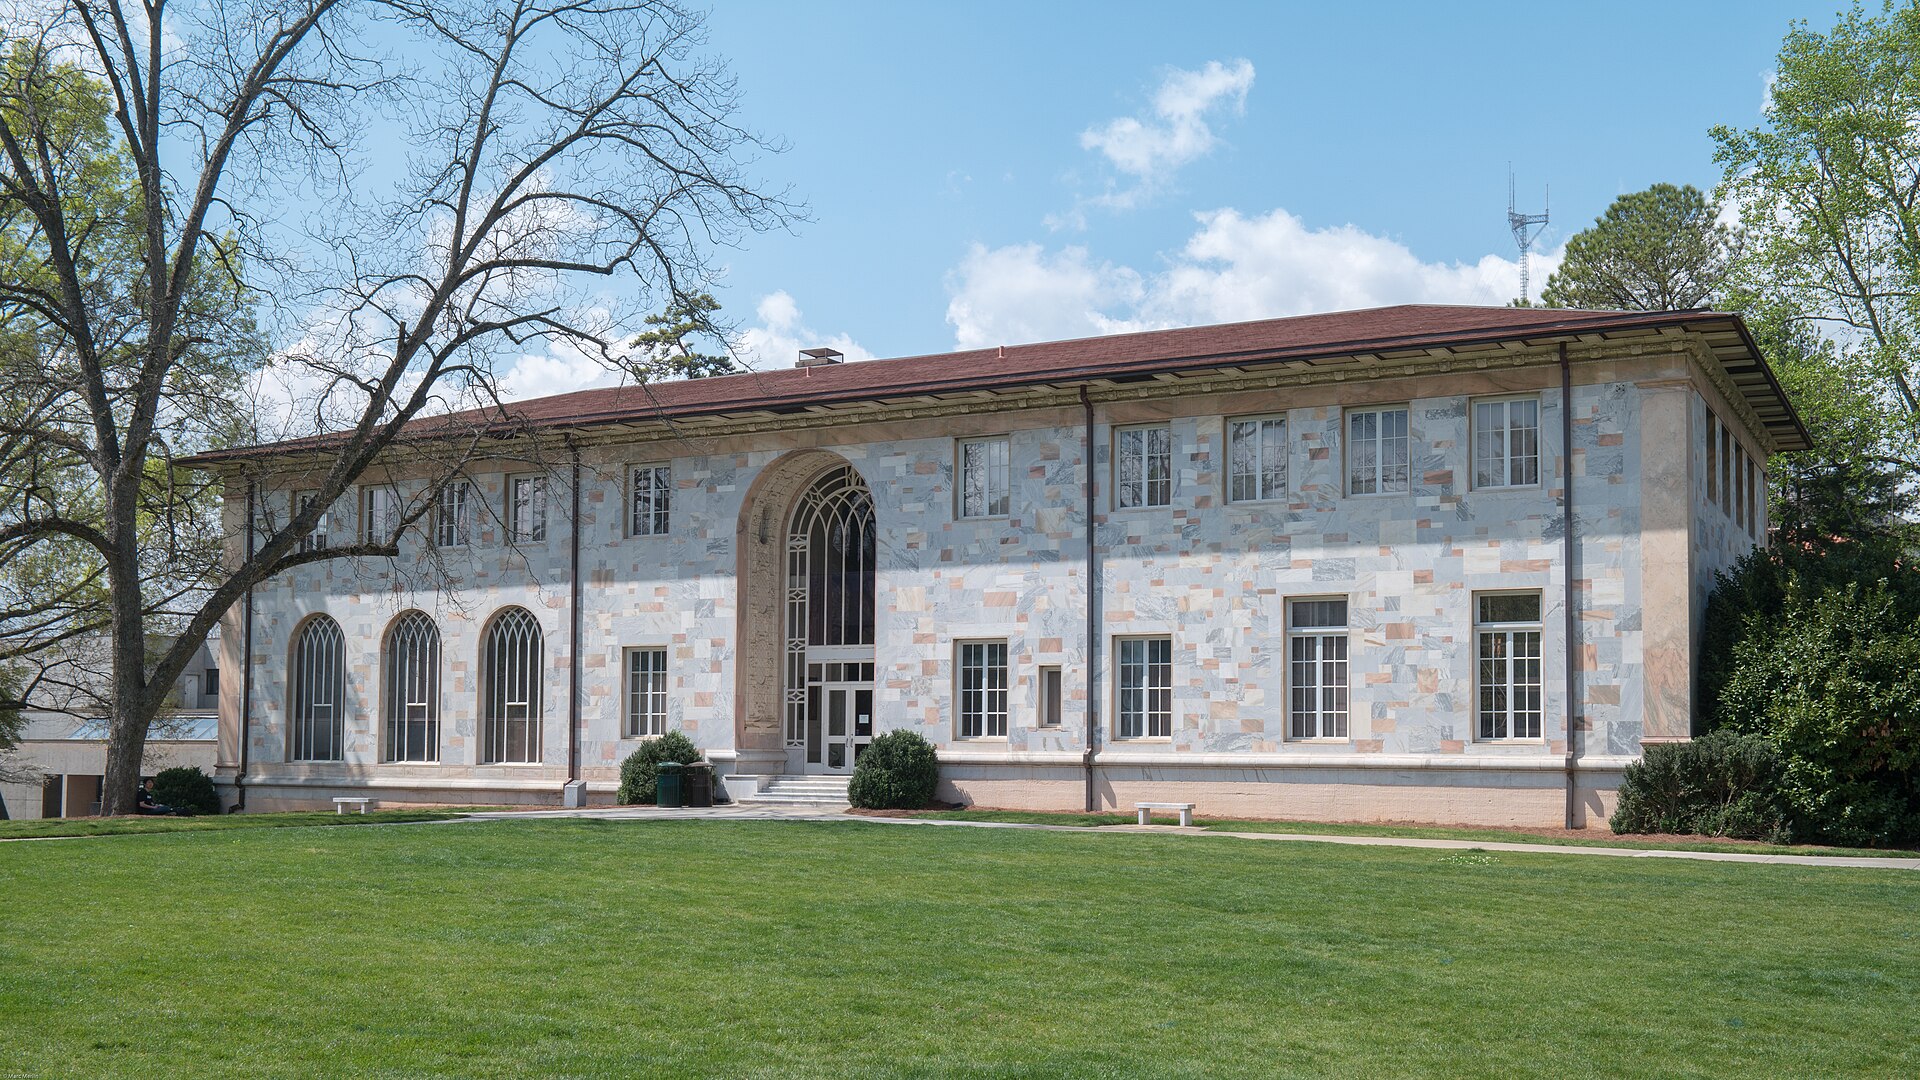
| Emory | Private university | 9.0% | fall 2026 (Class of 2030) | 3,852 of 42,873; Emory College only; Oxford College admitted 10.2% (2,773 of 27,113) |
| Notre Dame | Private university | 9% | fall 2026 (Class of 2030) | 9% printed, no admit count; 36,104 applicants |
| NYU | Private university | 9.1% | fall 2025 (Class of 2029) | 10,340 of 114,125 |
| Cornell | Ivy League | 9.2% | fall 2026 (Class of 2030) | 6,040 of 65,514 |
| Claremont McKenna | Liberal arts college | 9.4% | fall 2025 (Class of 2029) | 655 of 6,939 |
| UC Berkeley | Public university | 10.5% | fall 2026 (Class of 2030) | 13,992 of 133,157 |
| UCLA | Public university | 10.8% | fall 2026 (Class of 2030) | 15,903 of 146,672 |
| Carnegie Mellon | Private university | 11.1% | fall 2025 (Class of 2029) | 3,859 of 34,867 |
| WashU | Private university | 12.2% | fall 2026 (Class of 2030) | 4,057 of 33,214 |
| USC | Private university | 12.6% | fall 2026 (Class of 2030) | 10,006 of 79,331 |
| Georgia Tech | Public university | 12.8% | fall 2026 (Class of 2030) | 8,715 of 67,985 |
| Harvey Mudd | Liberal arts college | 13.2% | fall 2026 (Class of 2030) | 654 of 4,971 |
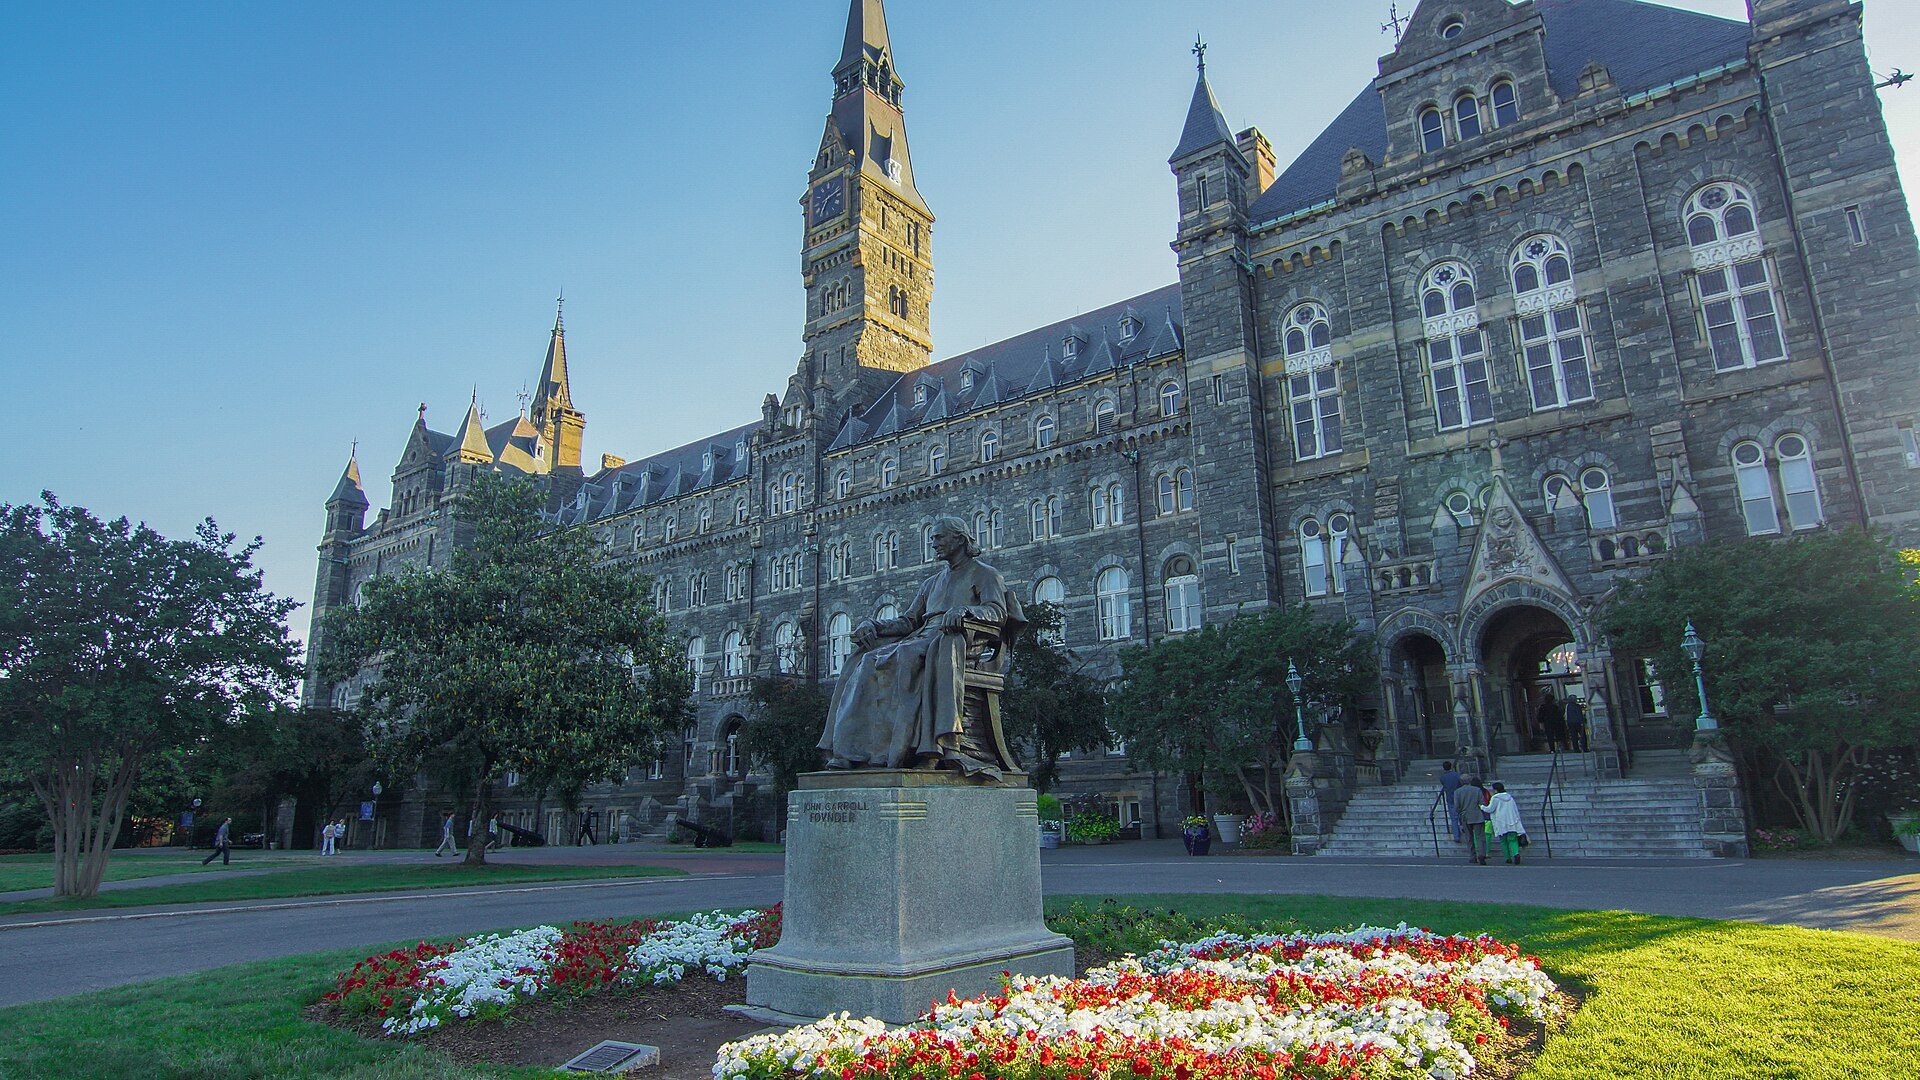
| Georgetown | Private university | 13.5% | fall 2025 (Class of 2029) | 3,618 of 26,822 |
| Tulane | Private university | 14.5% | fall 2025 (Class of 2029) | 4,763 of 32,942 |
| Michigan | Public university | 16.1% | fall 2026 (Class of 2030) | 17,495 of 108,774 |
| UNC Chapel Hill | Public university | 16.7% | fall 2025 (Class of 2029) | 12,751 of 76,247 |
Which colleges admit fewer than 5% of applicants?
Eleven schools in this guide: Caltech (3.8%), Stanford (3.8%), Princeton (4.1%), Columbia (4.2%), Harvard (4.2%), Yale (4.2%), University of Chicago (4.5%), MIT (4.6%), Vanderbilt (4.6%), Duke (4.7%) and Penn (4.9%). All are private research universities. Penn’s figure is for fall 2025 because Penn has not published a Class of 2030 admit count, and Harvard’s figure is for the Class of 2029, because Harvard had not published Class of 2030 figures as of October 27, 2026; it says it shares annual data “in the October/November timeframe” (Harvard admissions statistics).
Which colleges admit between 5% and 10% of applicants?
Fifteen schools: Brown (5.6%), Northeastern (5.6%), Dartmouth (5.8%), Johns Hopkins (6.1%), Bowdoin (6.5%), Amherst (6.8%), Northwestern (approximately 7%), Swarthmore (7.4%), Rice (8.0%), Williams (8.6%), Emory (9.0%), Notre Dame (9%), NYU (9.1%), Cornell (9.2%) and Claremont McKenna (9.4%). This band mixes three Ivies, other private universities and five of the six liberal arts colleges here. Small colleges admit few students in absolute terms: Swarthmore admitted 969 students from 13,029 applicants for fall 2026 (Swarthmore by the numbers), and Bowdoin 962 from 14,727 (Bowdoin Class of 2030 at a glance).
Which highly selective colleges admit 10% or more of applicants?
Eleven schools: UC Berkeley (10.5%), UCLA (10.8%), Carnegie Mellon (11.1%), WashU (12.2%), USC (12.6%), Georgia Tech (12.8%), Harvey Mudd (13.2%), Georgetown (13.5%), Tulane (14.5%), Michigan (16.1%) and UNC Chapel Hill (16.7%). A rate in this range still means most applicants are turned away, and at public universities the overall figure blends very different rates for residents and nonresidents.
Which public universities are the most competitive?
Among the five public universities here, UC Berkeley had the lowest fall 2026 rate, 10.5% (13,992 of 133,157), by our calculation from its student profile. UCLA admitted 10.8% for fall 2026 (15,903 of 146,672) in preliminary data from the UC Office of the President, which reflect “admission offers as of June 17, 2026” (UC Office of the President); its own fall 2025 profile showed 9.4%. Georgia Tech admitted 12.8% for fall 2026 (8,715 of 67,985), Michigan 16.1% for fall 2026 and UNC Chapel Hill 16.7% for fall 2025. Residency can change the picture: Georgia Tech says “The overall admit rate is 28% for Georgia residents, 9% for nonresidents” for the Class of 2030 (Georgia Tech Enrollment Management, March 27, 2026), and its 2026 admitted profile shows the same 28% and 9% (Georgia Tech 2026 first-year admitted profile). Our guides to UC Berkeley, UCLA and UNC Chapel Hill for out-of-state applicants go further.
Which liberal arts colleges are the most competitive?
Bowdoin (6.5%), Amherst (6.8%) and Swarthmore (7.4%) published the lowest Class of 2030 rates among the six liberal arts colleges here, by our calculation. Williams admitted 8.6% and Claremont McKenna 9.4% for fall 2025, and Harvey Mudd 13.2% for fall 2026. Pomona is not included because we could not find a recent official admit count, and Colby publishes only a rounded rate (8% for the Class of 2029). Amherst reports that it “received 17,786 applications, admitted 1,209 students, and enrolled 501” for the Class of 2030 (Amherst Class of 2030 profile).
How should applicants use these selectivity bands?
The view of Oriel Admissions is that every school in this guide is a reach for nearly every applicant, whatever its band, because each turns away most applicants. The bands help with balance: a list built only from the under 5% group carries more risk than one that spreads applications across bands and adds schools with higher rates. In our view, early rounds and residency can matter as much as the headline rate. Our guides to the easiest Ivy League school to get into, admissions statistics at the top 25 schools and Early Decision acceptance rates cover those questions.
Frequently Asked Questions About the Most Competitive Colleges
Among the 37 colleges in this guide, Caltech and Stanford had the lowest latest acceptance rates, each 3.8% for fall 2025, followed by Princeton at 4.1% for the Class of 2030. Several other schools sit within a percentage point, so the order can change from year to year.
In this guide, 11 schools do, using the latest official figure for each school: Caltech, Stanford, Princeton, Columbia, Harvard, Yale, University of Chicago, MIT, Vanderbilt, Duke and Penn. We cover only the colleges families ask us about most, so this is not a complete national count.
Among the five public universities in this guide, UC Berkeley, which admitted 10.5% for fall 2026 by our calculation. UCLA admitted 10.8% for fall 2026 in preliminary University of California data, and 9.4% for fall 2025. Rates for in-state and out-of-state applicants can differ widely at some public universities.
Among the six in this guide, Bowdoin, which admitted 962 of 14,727 applicants for the Class of 2030, or 6.5% by our calculation. Amherst admitted 6.8% and Swarthmore 7.4% for the same class.
No. Schools are grouped into three bands by their latest official acceptance rate and sorted by that rate within the table. The order says nothing about academic quality or fit.
Colleges publish at different times. Some announce Class of 2030 admits or rates in the spring or summer, while others had not published Class of 2030 counts by October 27, 2026, so we use their Common Data Set, which reports the class that entered in fall 2025. We label the year of every figure.
Not necessarily. Applicant pools differ, early rounds admit at different rates, and some public universities admit residents and nonresidents at very different rates. Georgia Tech, for example, reports a Class of 2030 admit rate of 28% for Georgia residents and 9% for nonresidents.
Oriel Admissions suggests treating every school in this guide as a reach and spreading applications across selectivity bands, early rounds and schools with higher acceptance rates. The bands are a planning tool, not a prediction for any one student.
Sources: Caltech CDS 2025-2026, Stanford CDS 2025-2026, Princeton profile (as of August 18, 2026), Columbia Class of 2030 announcement, Harvard CDS 2025-2026, Yale News, March 26, 2026, University of Chicago CDS 2025-2026, MIT CDS 2025-2026, Vanderbilt admissions profile, Duke Today, March 31, 2026, Penn CDS 2025-2026, Brown admission facts (as of September 2026), Northeastern CDS 2025-2026, Dartmouth News, March 30, 2026, Johns Hopkins CDS 2025-2026, Bowdoin Class of 2030 at a glance, Amherst Class of 2030 profile, Northwestern admission decisions FAQ (“Approximately 7%”), Swarthmore by the numbers, Rice CDS 2025-2026, Williams CDS 2025-2026, Emory student profile, Emory College Class of 2030, Notre Dame admissions class profile (“9% Admit Rate”), NYU CDS 2025-2026, Cornell University Factbook (updated September 1, 2026), Claremont McKenna CDS 2025-2026, UC Berkeley student profile (data as of 8/2026), UC Office of the President, preliminary fall 2026 admissions (offers as of June 17, 2026) and applications, Carnegie Mellon CDS 2025-2026, WashU Class of 2030 profile, USC first-year student profile, fall 2026, Georgia Tech 2026 first-year admitted profile, Harvey Mudd Class of 2030 profile, Georgetown CDS 2025-2026, Tulane CDS 2025-2026, Michigan first-year class profile (9/29/2026), UNC Chapel Hill CDS 2025-2026, Georgia Tech Enrollment Management, March 27, 2026, Harvard admissions statistics. All read October 26 and 27, 2026.
About Oriel Admissions
Oriel Admissions is a college admissions consulting firm advising families nationwide on elite university admissions strategy, with offices in Princeton, New Jersey and New York. Our team pairs deep admissions expertise with a distinctive 360 approach spanning academic planning, extracurricular strategy, essays and application execution. To discuss your strategy, schedule a consultation.